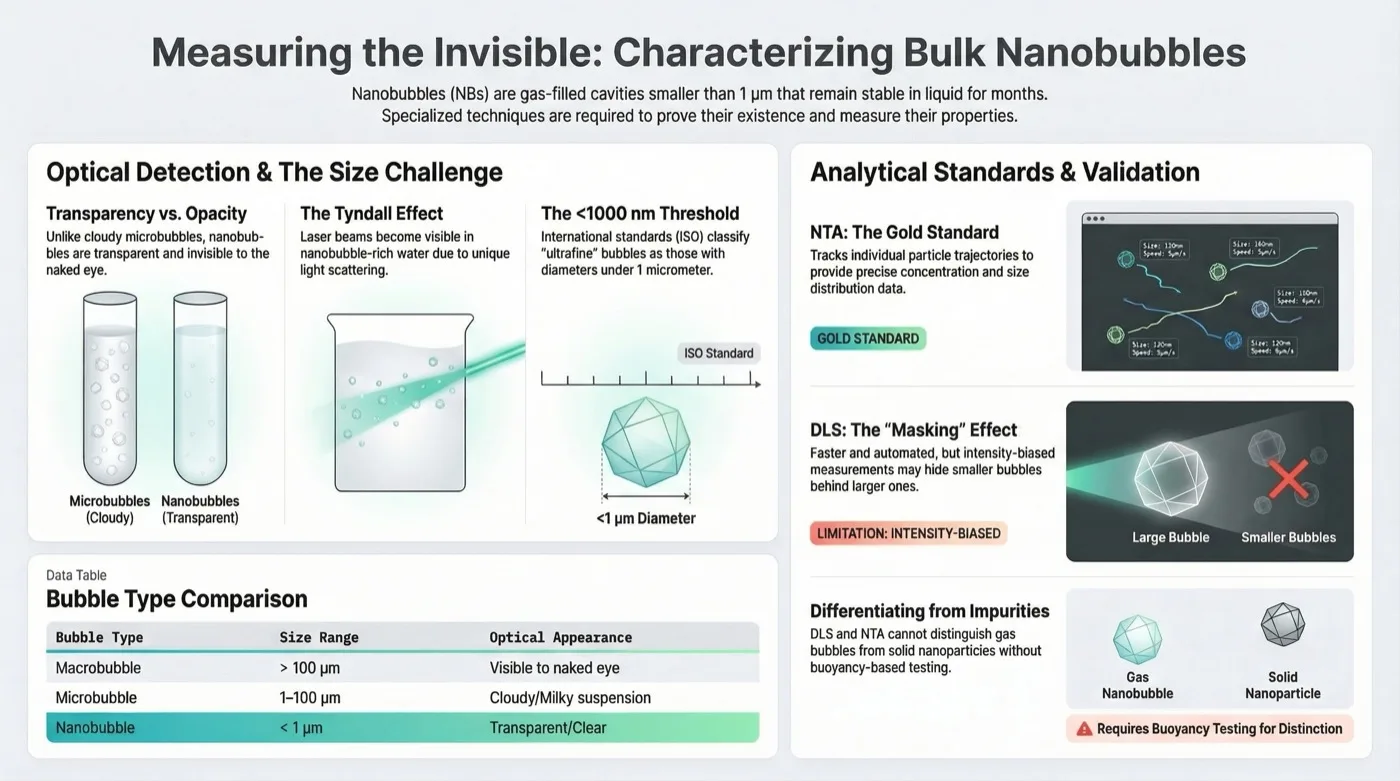
1. The Visibility Challenge: Transparency vs. Opacity
The primary distinction between microbubbles (MBs) and nanobubbles (NBs) visible to the naked eye is the turbidity of the solution. When generated, MBs (typically 10–50 µm) scatter significant light, causing the water to appear "milky" or cloudy. However, MBs rise rapidly and burst at the surface, causing the milkiness to vanish quickly Agarwal et al., 2011. In contrast, NBs are smaller than the wavelength of visible light (typically <200 nm to 1 µm) and possess negligible buoyancy. Consequently, they do not scatter light to the extent of causing opacity, rendering the NB solution transparent even at high concentrations Etchepare et al., 2017; Babu and Amamcharla, 2023.
2. Nanoparticle Tracking Analysis (NTA): The "Gold Standard"
NTA has emerged as the preferred method for characterizing NBs because it overcomes the limitations of bulk light scattering methods.
- Working Principle: NTA utilizes a laser beam to illuminate particles in a liquid sample. A microscope coupled with a high-sensitivity camera captures the light scattered by individual NBs. The software tracks the Brownian motion of each particle frame-by-frame. Using the Stokes-Einstein equation, the hydrodynamic diameter is calculated based on the speed of particle diffusion (smaller particles move faster) Nirmalkar et al., 2018; Azevedo et al., 2016.
- Why it is the "Gold Standard": Unlike other methods, NTA provides a direct measurement of bubble number concentration (bubbles/mL) alongside size distribution. It allows for the discrimination of individual particles even in polydisperse samples, whereas other methods bias results toward larger particles. Researchers like Alheshibri and Ushikubo utilize NTA to confirm the stability and existence of NBs because it can visualize particles in real-time and provide precise counting statistics not available through ensemble methods Alheshibri et al., 2016; Ushikubo et al., 2020; Azevedo et al., 2019.
3. Dynamic Light Scattering (DLS): Use and Limitations
- Usage: DLS measures the fluctuations in scattered light intensity caused by the Brownian motion of particles to determine an average size. It is widely used due to its ease of operation and ability to measure particles from sub-nanometer ranges up to microns Gurung et al., 2016; Li and Zhang, 2022.
- Limitations vs. NTA: The primary limitation of DLS is that the intensity of scattered light is proportional to the diameter to the power of six (d^6). Consequently, a few large microbubbles or contaminants can mask the signal of millions of NBs, shifting the reported mean size to a higher value. Furthermore, DLS cannot provide the concentration (number density) of bubbles, which is a critical parameter for evaluating NB generator performance Nirmalkar et al., 2018; Li and Zhang, 2022.
4. Differentiation from Impurities
Distinguishing gas-filled NBs from solid nanoparticles or oil droplets is critical for validation. Researchers employ several stress tests:
- Response to Pressure: NBs are compressible. When external pressure is applied, NBs shrink or disappear (dissolve), whereas solid nanoparticles maintain their size. This response is often tracked using DLS or NTA under pressure Alheshibri and Craig, 2019; Ahmed et al., 2018.
- Freeze-Thaw Cycles: NBs are thermodynamically unstable upon freezing. Subjecting the solution to freeze-thaw cycles destroys NBs, while solid contaminants remain detectable. If the particle count drops significantly after thawing, the initial population was comprised of NBs Nirmalkar et al., 2018; Li et al., 2021.
- Resonant Mass Measurement (RMM): This technique differentiates particles based on buoyancy. NBs possess negligible mass (positive buoyancy in liquid), whereas solid particles have negative buoyancy. This allows for clear differentiation between gas and solid phases Alheshibri and Craig, 2019; Azevedo et al., 2019.