You paid for it. Your water decides.
Fertilizer, feed, reagent, oxygen — none of it works dry. All of it is delivered by the one input in your operation that has never been specified. We specify it, and we measure what changes on your site.
Every process here loses the same thing. Just in a different place.
Oxygen, reagent, fertilizer, recovery — the loss is rarely dramatic and never itemized on an invoice, which is exactly why it survives. Here is where it usually sits.
-
Wastewater
Aeration can run up to ~60% of a plant’s power bill. In process water with surfactant load, alpha factors derate fine-bubble diffusers to 0.30–0.50 of their clean-water rating — the equipment is not delivering what its spec sheet says.
Published research -
Mining · flotation
Up to 50% of reagent spend, and 16–21% of fine particles lost to tailings.
Published research -
Agriculture
Fertilizer that moves past the root zone — published trials show ~20–25% reductions at matched yield.
Published research -
CEA & hydroponics
Root-zone oxygen as the ceiling on the crop, not light or nutrient. Root mass up to 126% in published trials.
Published research -
Aquaculture
Dissolved oxygen as the cap on stocking density — the constraint that decides how much biomass the same water will carry.
Mechanism established
Sometimes the answer is that nothing is leaking. Our heap-leach model returns exactly zero for a circuit already sitting at its cyanide-to-oxygen optimum, and says so rather than manufacturing a benefit. On a well-run fine-bubble municipal plant, our side can draw more power than yours — and our own tooling will tell you that before we do.
Not three products. One system.
Smaller than a red blood cell, our bubbles stay suspended for months — continuously delivering oxygen where it's needed. Up to 4× more oxygen than conventional systems, and they strip biofilm mechanically, cutting the sanitizer dosing that job used to take.
Controlled pressure changes create microscopic implosions in the water — enough energy to rupture pathogen cell walls, break down contaminants, and drive oxidation in the water itself. No UV lamps. No chemical inventory to buy, store, or meter.
Our inline static mixing restructures fluid flows so gases, nutrients, and chemical dosing distribute evenly. By eliminating dead zones and maximizing contact area, we get more out of every reagent — and unmatched mass-transfer efficiency.

What are you running?
Pick one — the evidence and the ROI below retune to it.
Agriculture
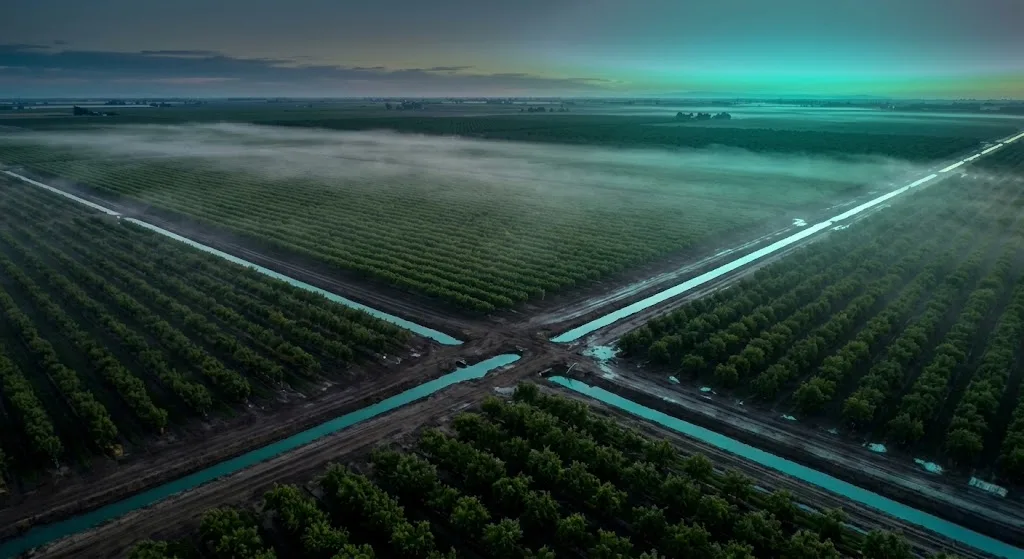
Higher yields with less water and fertilizer across orchards, vineyards and row crops.
Advanced Wastewater
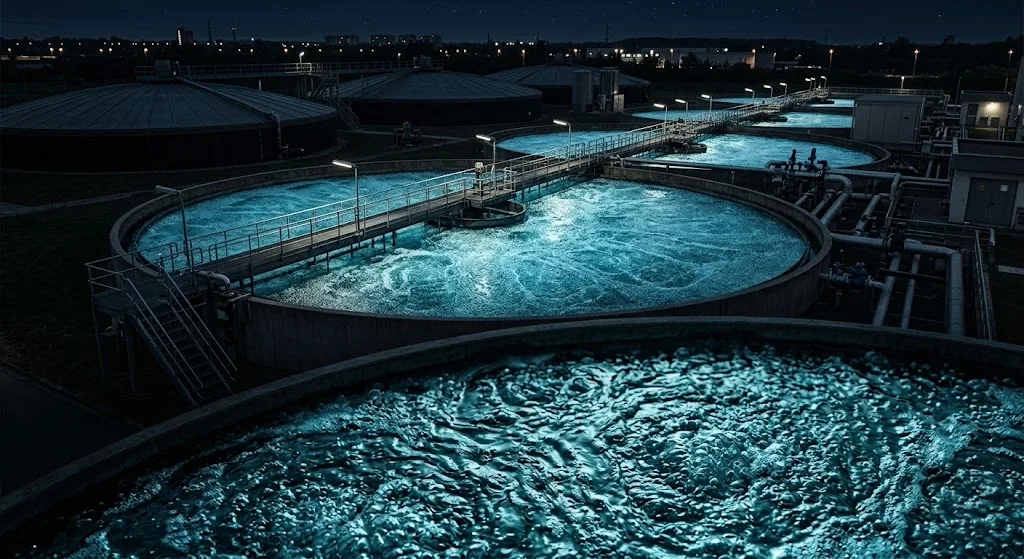
Cut aeration energy — up to 60% of your power bill — while shrinking sludge and killing odor.
CEA & Hydroponics
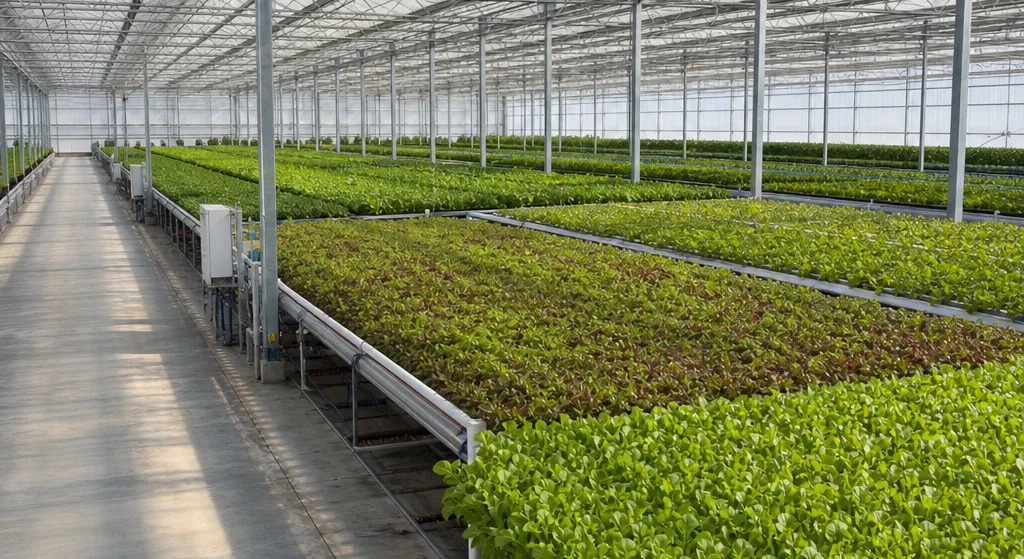
Biofilm-free lines, >30 ppm dissolved oxygen, root mass up to 126% larger.
Cannabis
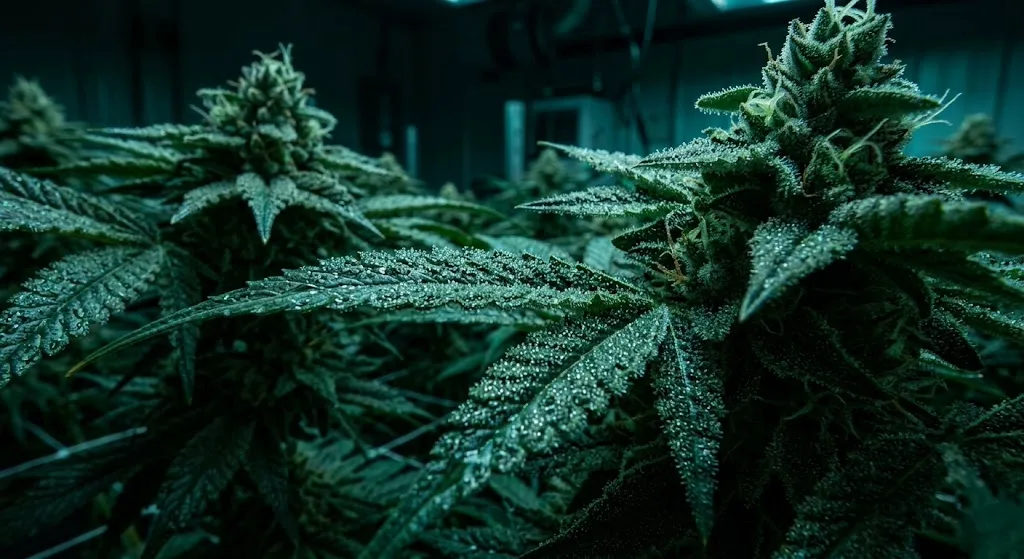
+30% biomass with +15% final yield, measured at GB Sciences.
Mining & Extraction
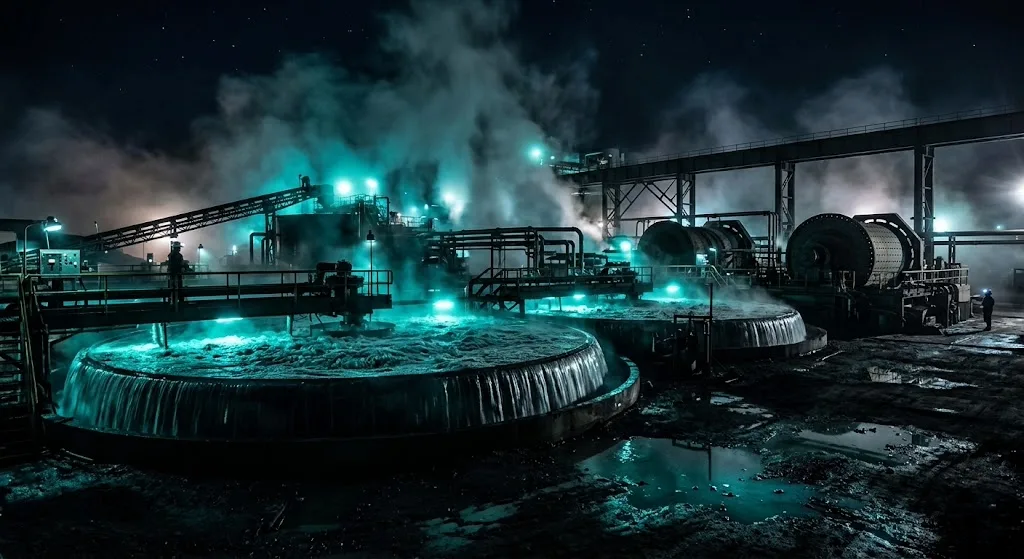
Recover fine particles lost to tailings and cut reagent spend up to 50%.
Oil & Gas
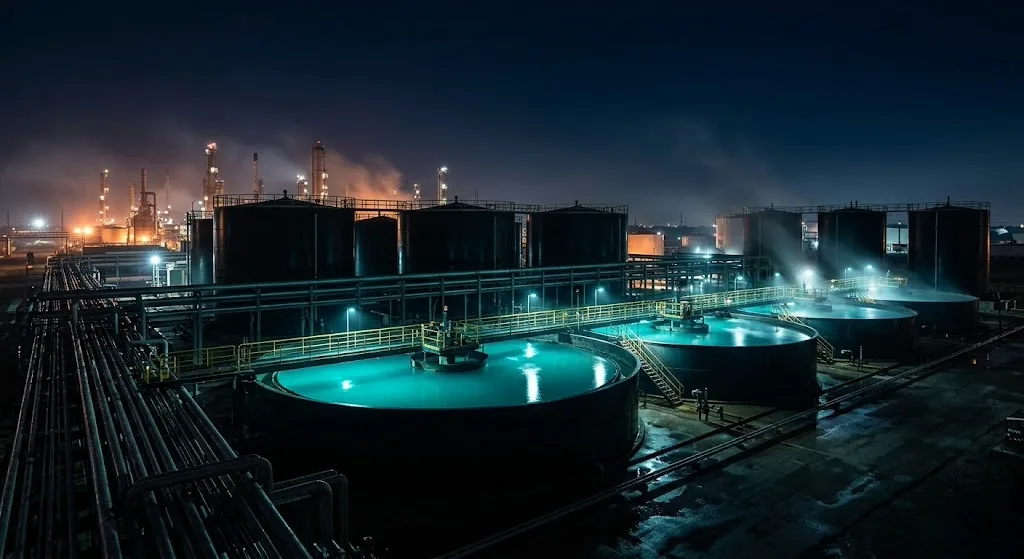
Lower crude viscosity, cleaner produced water, no biocides.
Aquaculture & Restoration
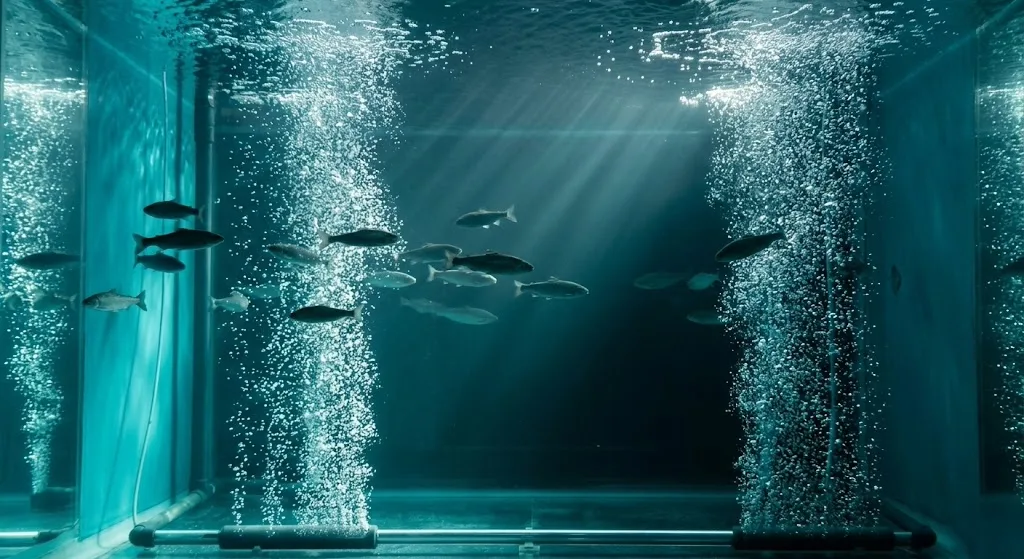
Stable dissolved oxygen top to bottom, fewer losses, higher stocking density.
Every number we publish, with its receipt.
Three provenance tiers, never blurred. Field data was measured in a Kairospace deployment. Published research is independent peer-reviewed literature — not our result. Independent lab is a third party measuring our water or our hardware, outside peer review — neither of the other two.
| Metric | Value | Where | Provenance | Detail |
|---|---|---|---|---|
| Biomass | +30% | GB Sciences | Field | 0.23 → 0.31 lb/plant |
| Yield | +15% | GB Sciences | Field | Distinct from biomass |
| Cuts per plant | +25–35% | CLTVTD | Field | Healthier mother stock |
| Salt compaction | −35.4% | Yorba Linda CC | Field | 18-month pilot |
| Water penetration | +24.7% | Yorba Linda CC | Field | 18-month pilot |
| Dissolved oxygen | +300% | Yorba Linda CC | Field | Treated green |
| Stem growth rate | 2.3× | FruitWorld | Field | 0.035 → 0.08 mm/day |
| Veg & prop time | Shortened | Green Go | Field | First room at 6 weeks |
| Bubble size | < 200 nm | Independent lab | Lab | Sized under ISO 20480 |
| Yield lift, general | ~25% avg | KST deployments | Field | Sometimes more, sometimes less |
| Payback period | < 1 yr | KST model | Field | Varies by site |
| Aeration share of power | up to ~60% | Literature | Research | Plant power bill |
| O₂ transfer efficiency | >85% vs ~15% | Literature | Research | vs. conventional |
| Reagent savings | up to 50% | Literature | Research | Flotation |
| Fine-particle recovery | +16–21% | Literature | Research | Lost to tailings |
| Crude viscosity | up to 40% | Literature | Research | Reported range 33–84% |
| Root mass | up to 126% | Literature | Research | vs. untreated control |
| Germination uplift | 15–25% | Literature | Research | Seed trials |
| Fertilizer reduction | ~20–25% | Literature | Research | At matched yield |
Field — measured in a Kairospace deployment or pilot.
Research — independent peer-reviewed literature, stated as such and never as our own result.
Lab — an independent laboratory characterized our water or our hardware, outside peer review; not our field measurement and not the literature.
Source of truth: CLAIMS.md. If a figure isn't in that table, it doesn't appear on this site.
What does this do to your P&L?
Five live calculators — payback, NPV, and IRR on your own numbers, with a peer-reviewed source on every assumption. Nothing gated, nothing to submit: the figures move as you type.
1-yr moving parts
bubble size characterized
by certified KST techs
before you commit
Find out how much you're leaving on the table.
Tell us about your operation and we'll send a custom ROI estimate in 48 hours. No commitment. No sales pressure. Just numbers.