What was measured
Food deserts are areas where affordable, healthy food is hard to reach, and parts of Southern Nevada are among them. Green Side Up Vertical Farms, led by Alaric Overbey and Chef Mitch Earl, works with local organizations to grow fresh produce close to those communities. We ran this pilot with them to test Kairospace water treatment in their towers.
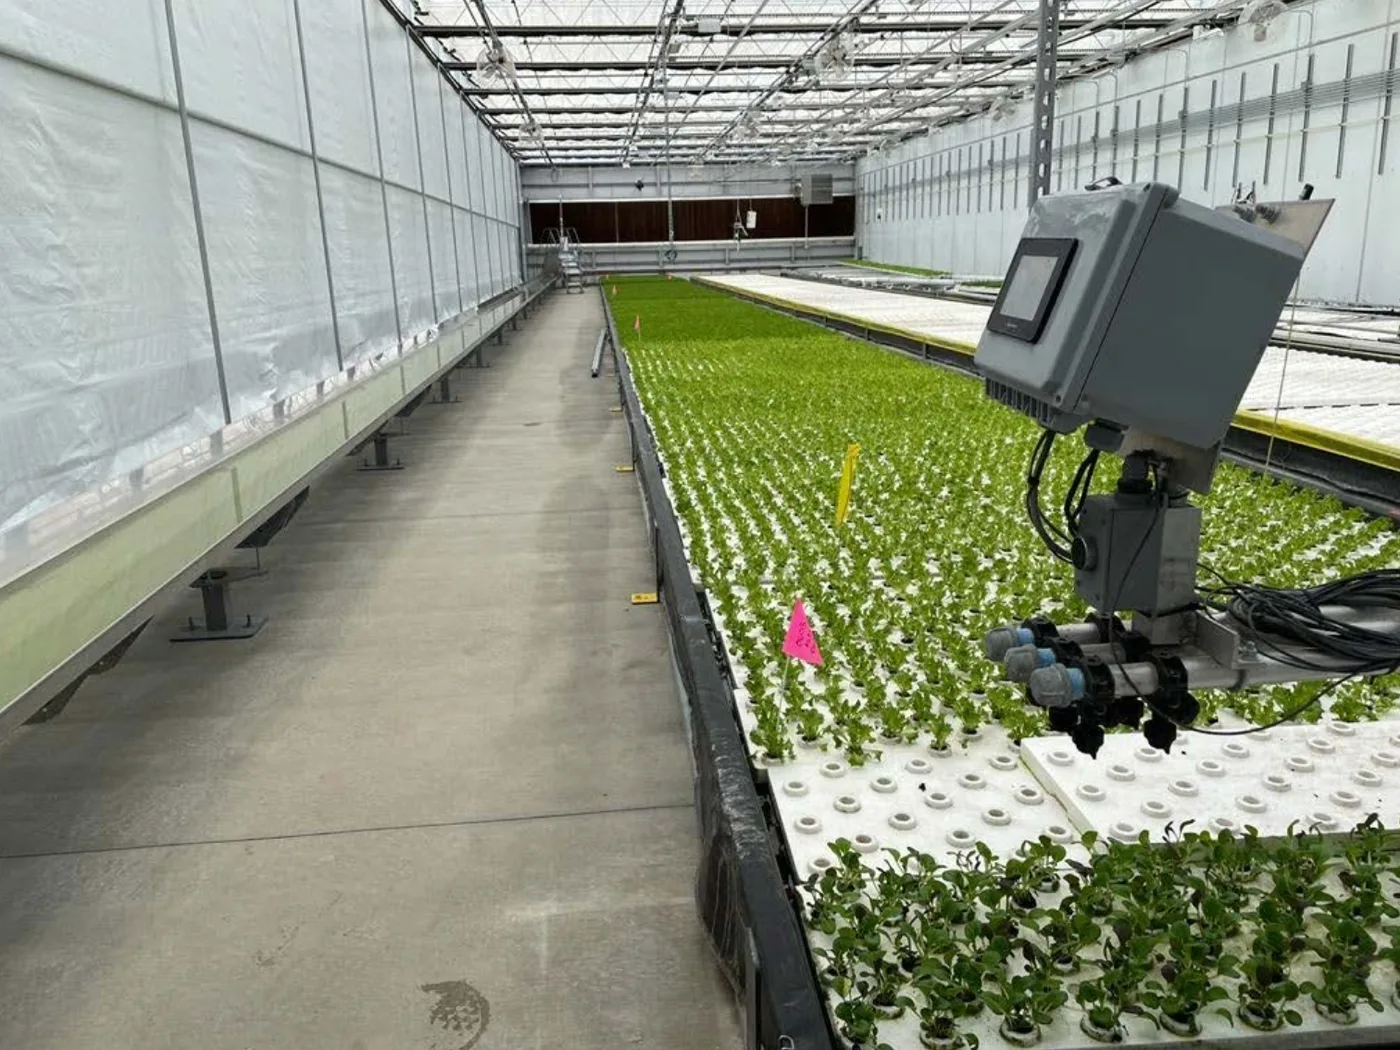
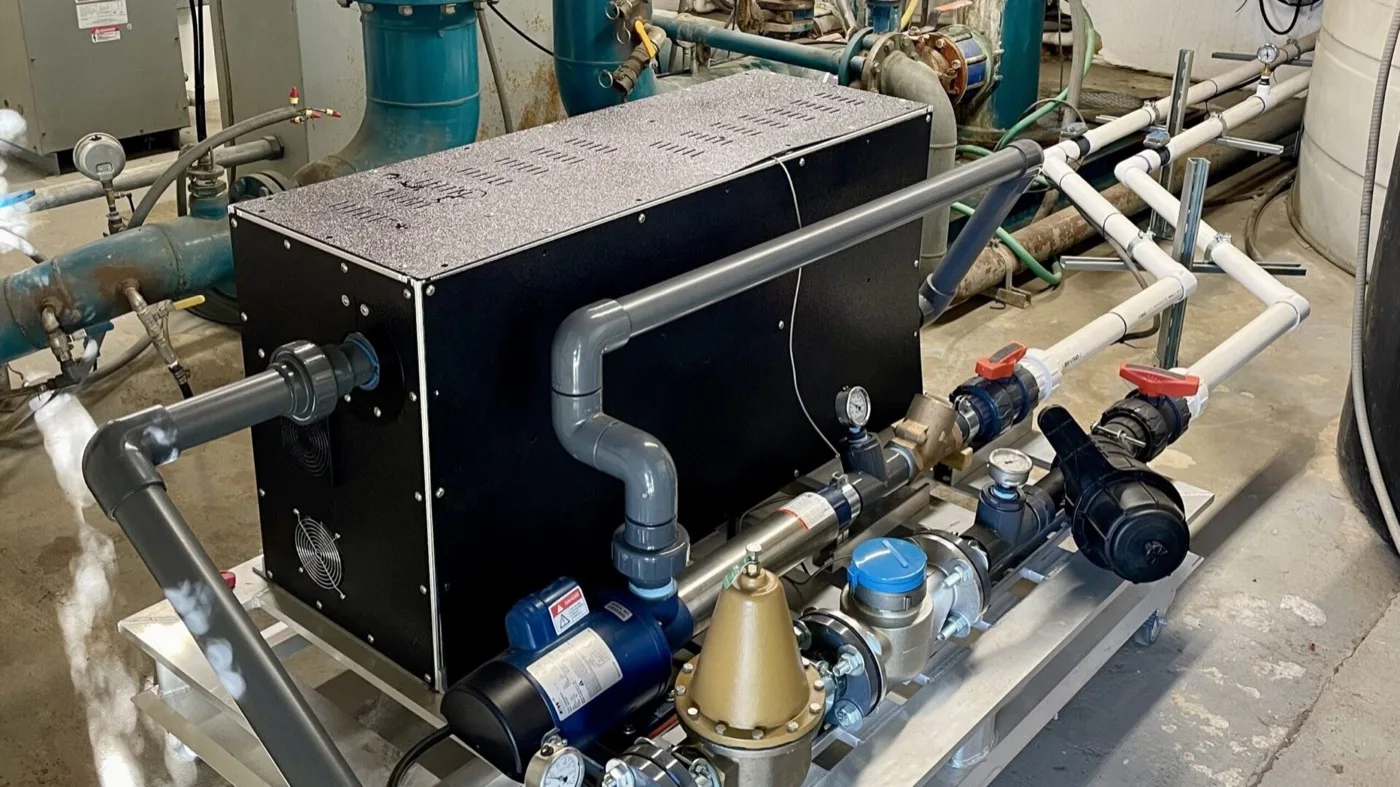
- Setting. Leafy green lettuce in recirculating vertical farm towers, with the Kairospace AG PACK Mini producing treated water carrying sonicated oxygen ultrafine bubbles.
- Comparison. Treated towers (T1, T2) against untreated control towers (C1, C2) — n = two towers per group. Photoperiods and water cycles were timed and synchronized across all groups.
- Instruments and protocol. Standard EC, pH and dissolved-oxygen probes, with every group monitored and adjusted to the same nutrient-solution profile. At harvest we assessed fresh weight, Brix, size, shape, leaf area, flavor and texture.
- Duration. Two separate validation series, each a full growth cycle of about 45 days. Treatment started at transplant and ran about 28 days through vegetative growth.
Results
- 24.16 mg/L dissolved oxygen, against 8.05 mg/L · KST field data
Treated groups against control groups — about three times the control reading. - ~3,000 g total wet weight on the top treated tower, against ~2,000 g · KST field data
The second pair: ~2,500 g treated against ~1,800 g control. Approximate tower totals, n = two towers per group. - ~8% Brix in both treated towers, against ~6% and ~5% · KST field data
The two control towers read about 6% and 5%. Brix is a soluble-solids reading linked to sweetness. - Larger root systems and denser foliage · KST field data
Seen in photographs of treated and control plants at harvest — a visual observation, not a measured figure.
What this does not show
- One site, two towers per group. A demonstrated result at Green Side Up, not an expected value elsewhere, and too small a sample for a statistical test.
- The weights are approximate tower totals, read as “about”, not per-plant yield.
- Brix is a soluble-solids reading, not a measure of nutritional value.
- Two runs of one ~45-day cycle, not a multi-season trial.
Glossary
Brix
The percentage of dissolved solids, mostly sugars, in plant juice, read with a refractometer. Growers use it as an indicator of sweetness and eating quality.
Dissolved oxygen
The oxygen dissolved in the nutrient solution, in mg/L. Roots respire, and this is the oxygen they draw on.
Total wet weight
The fresh weight of all harvested plant material from a tower, before any drying. It measures growth, not saleable yield per plant.