Make your process water work harder, do more and deliver better.
Inline gas and liquid injectors, cavitation and gas generation systems, sized for your operation. We measure performance against your site’s baseline.
Measured on customer sites: +15% final yield at GB Sciences (one site) · 24.16 vs 8.05 mg/L dissolved oxygen in treated vs control towers at a Southern Nevada vertical farm · 2.3× stem growth rate at FruitWorld (0.035 → 0.08 mm/day). See every figure and its source
- InstallTies into your existing piping in 1–3 days
- Lead time4–6 weeks from down payment to hardware on site
- Warranty3 years on non-moving parts, 1 year on moving parts
- Where to buyDirect from Kairospace, or through your hydro store or irrigation dealer. Find yours →
- Lease-to-own3–4 month terms, with lease fees credited toward the purchase
Every process here loses the same thing. Just in a different place.
Oxygen, reagent, fertilizer, recovery — the loss is rarely dramatic and does not show up as a line on an invoice, which is exactly why it survives. Here is where it usually sits.
-
Cannabis
Dissolved oxygen falls as the batch tank warms and the water sits in the drip lines: air-saturated water holds about 9.1 mg/L at 68 °F and 8.3 mg/L at 77 °F. The root zone gets less than the tank reading suggests, and that is where root development and your inoculants feel it.
Textbook solubility -
CEA & hydroponics
In DWC, NFT and towers, a reservoir that runs warm holds less oxygen, and root-zone oxygen can cap the crop before light or nutrient does. Up to 126% more root mass in published trials.
Published research -
Agriculture
Fertilizer that moves past the root zone — published trials show ~20–25% reductions at matched yield.
Published research -
Aquaculture
Dissolved oxygen as the cap on stocking density — the constraint that decides how much biomass the same water will carry.
Mechanism established -
Wastewater
Aeration can run up to ~60% of a plant’s power bill. In process water with surfactant load, alpha factors derate fine-bubble diffusers to 0.30–0.50 of their clean-water rating — the equipment is not delivering what its spec sheet says.
Published research -
Mining · flotation
Up to 50% of reagent spend, and 16–21% of fine particles lost to tailings.
Published research
Not three products. One system.
Smaller than a red blood cell, with bubble size characterized by an independent laboratory (nanoparticle tracking analysis). Ultrafine bubbles persist far longer than coarse bubbles, which rise and burst at the surface, so the oxygen goes where it is needed instead of out the top of the tank. The shear at the injector also lifts biofilm mechanically, which supports a sanitation program rather than replacing one.
A controlled pressure drop forms vapor cavities that collapse within microseconds, releasing intense local shear and forming hydroxyl radicals in the water itself. What that does to a given contaminant or organism depends on flow, dose and the number of passes, so we test it on your water before we promise a result.
Our inline static mixing restructures fluid flows so gases, nutrients, and chemical dosing distribute evenly. By reducing dead zones and increasing contact area, we get more out of every reagent — and raise mass-transfer efficiency on the line pressure you already have.

What are you running?
Pick one — the evidence and the ROI below retune to it.
Cannabis
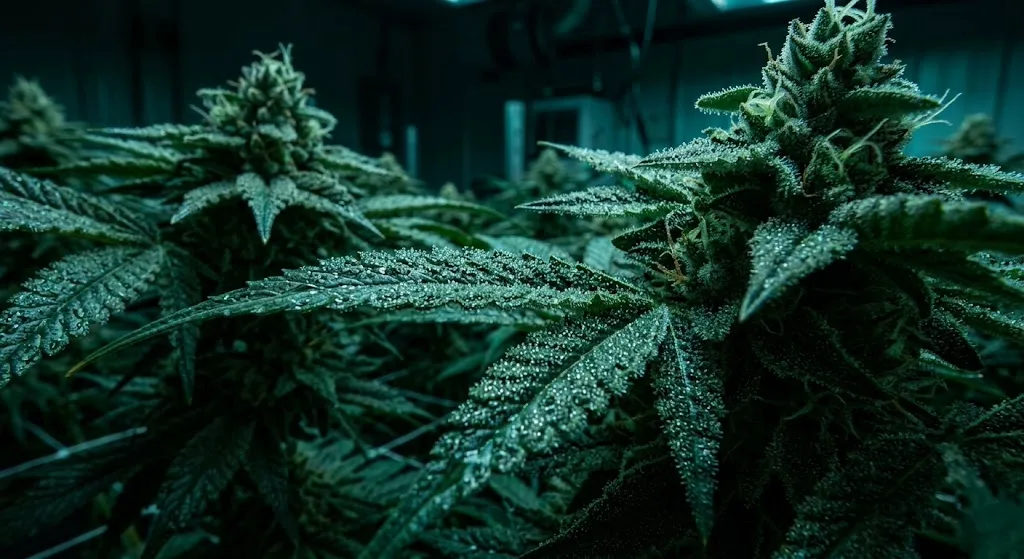
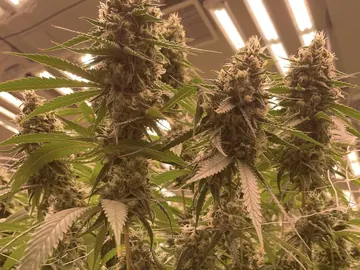
Root development first: oxygen-rich water from the batch tank to the dripper, working alongside your nutrient and sanitation program. At GB Sciences, one site, final yield rose 15% and biomass 30%, measured separately.
CEA & Hydroponics
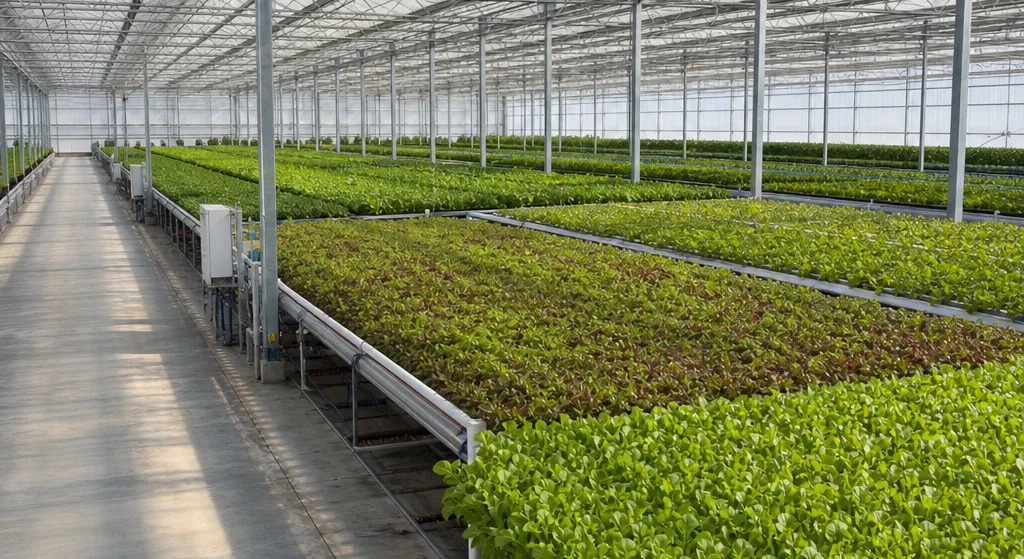
More root through the warm months in DWC, NFT and towers, working alongside your sanitation program. At a Southern Nevada vertical farm, treated towers measured 24.16 mg/L dissolved oxygen against 8.05 mg/L in the control towers.
Agriculture
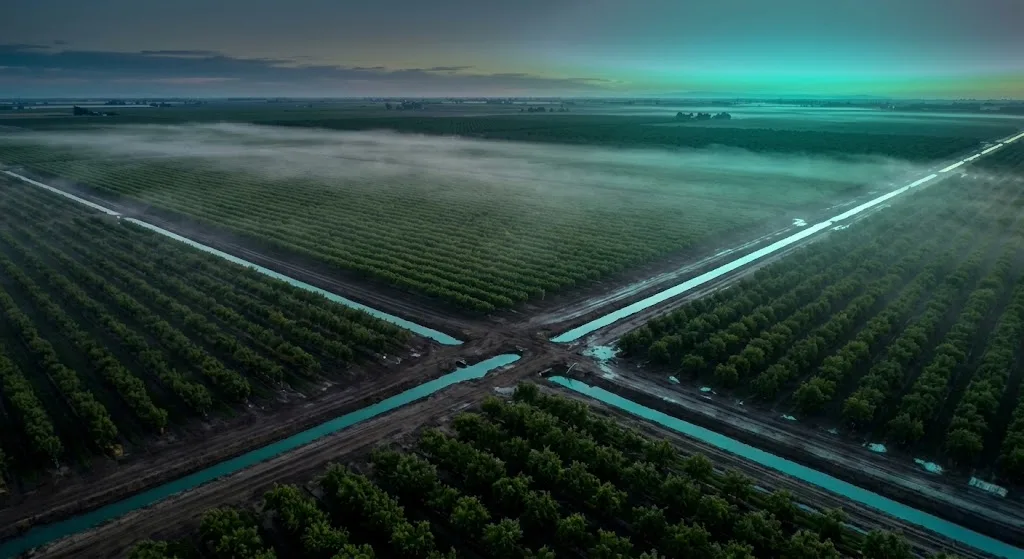
Oxygen injected at the pump station feeds roots and the aerobic soil biology that helps irrigation move down instead of sitting on top. For orchards, vineyards, row crops and turf. At Yorba Linda Country Club, over three months: +24.7% water penetration against two control greens.
Aquaculture
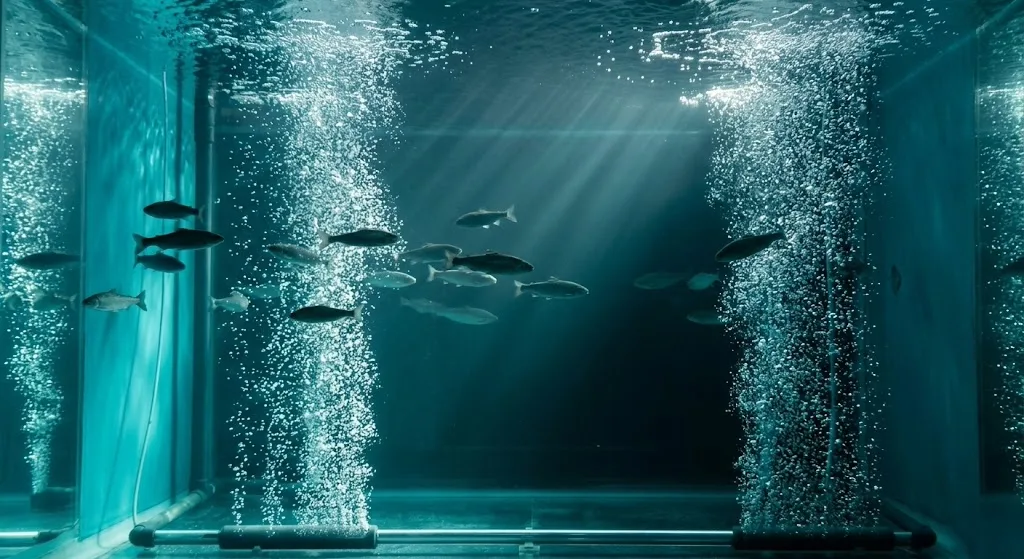
Oxygen through the whole water column, sized on peak feed demand rather than pond volume, so the pre-dawn low has headroom.
Wastewater
Aeration can be up to ~60% of a plant's power bill. Where it is coarse-bubble, mechanical or a lagoon, ultrafine bubbles transfer far more of the oxygen they carry; against a good fine-bubble grid, the calculator tells you when we lose.
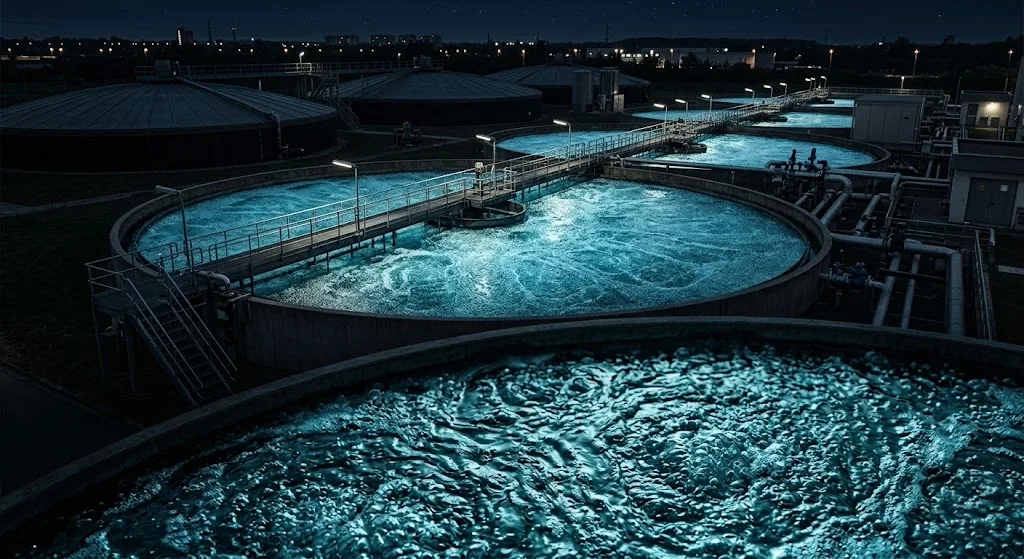
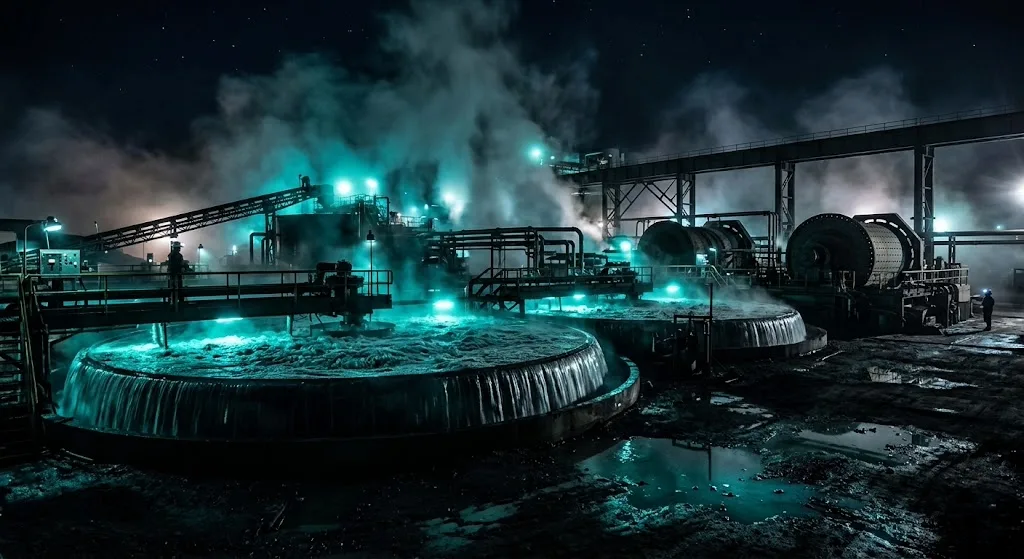
Mining
Published flotation research reports up to 50% lower reagent use and 16–21% more fine-particle recovery with nanobubbles. We test it on your ore before we promise you a result.
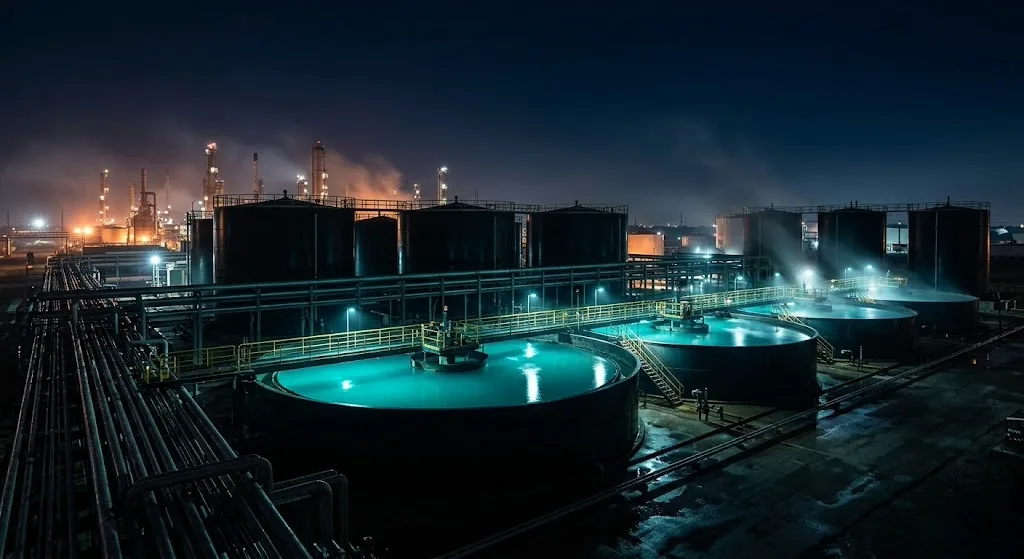
Oil & Gas
Published trials report lower crude viscosity and cleaner produced water. We build the inline hardware and have not yet measured it in the field, so the first step is a bench test on your produced water.
Every number we publish, with its receipt.
Four provenance tiers, never blurred. Field data was measured in a Kairospace deployment. Published research is independent peer-reviewed literature — not our result. Independent lab is a third party measuring our water or our hardware, outside peer review — neither of the other two. Model is our own calculation on our own inputs — it was computed, not measured, and it is the weakest of the four.
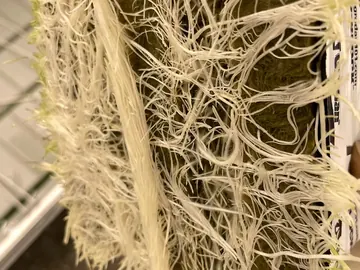
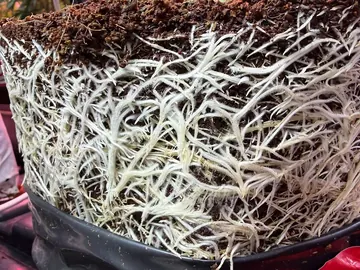 CannabisRoot mass lifted from the pot, white and fibrous through the full profileOn a customer siteField photo
 +15% · +30%Final yield · biomassGB Sciences · one site, two different measurementsKST field data
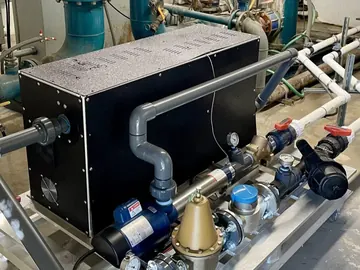
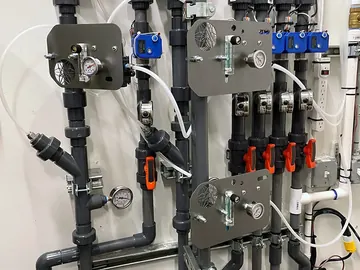 CannabisInline injector retrofitted to an existing manifoldOn a customer siteField photo
- 24.16 mg/LDissolved oxygen, treated towersSouthern Nevada vertical farm · vs 8.05 mg/L in control towersKST field data
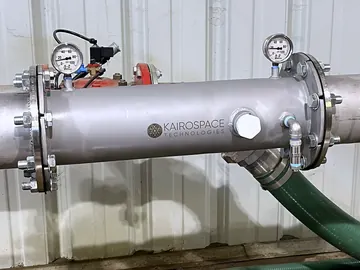
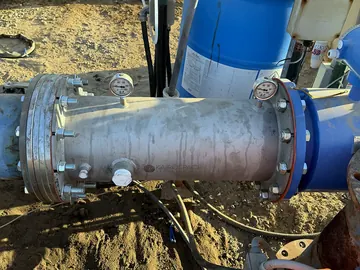 Agriculture10-inch injector inline on the irrigation mainOn a customer siteField photo
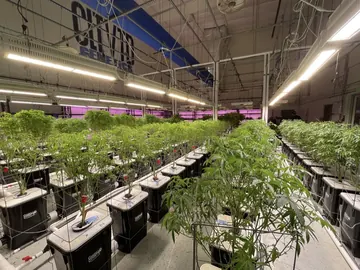 +25–35%Cuts per plantCLTVTD Genetics · propagation, not flower yieldCustomer-reported
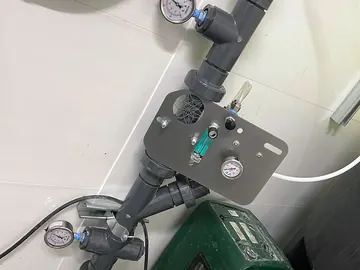 CannabisInjector after the batch pump, direct DO injectionOn a customer siteField photo
 +24.7%Water penetrationYorba Linda CC · treated green vs two control greens, 3 monthsKST field data
 CannabisRoot hairs at the face of the blockOn a customer siteField photo
- 2.3×Stem growth rateFruitWorld · 0.035 → 0.08 mm/day in seasonKST field data
 AgriculturePlumbed into the pump house lineOn a customer siteField photo
- up to 126%Root massTop of the range across published trialsPublished research
 CannabisRoots breaking through every face of the cubeOn a customer siteField photo
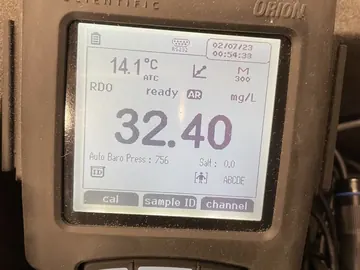 +300%Dissolved oxygenYorba Linda CC · treated irrigation water, same pilotKST field data
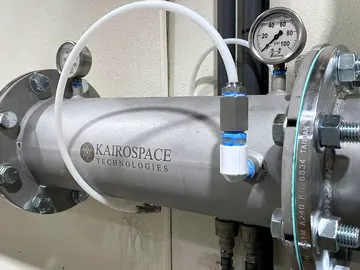 AgricultureOxygen feed into the injector bodyOn a customer siteField photo
- 20–25%Less fertilizerAt matched yield, in published trialsPublished research
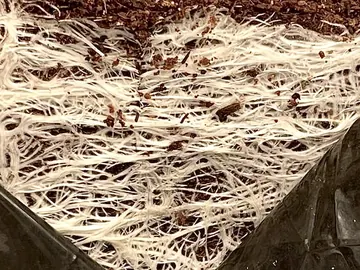 CannabisRooting across the slab, under the coco layerOn a customer siteField photo
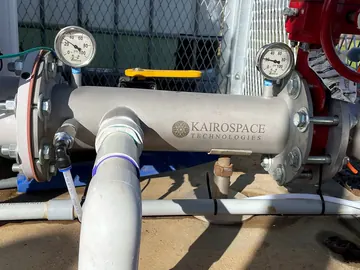 AgricultureInline at the pump station, gauges either sideOn a customer siteField photo
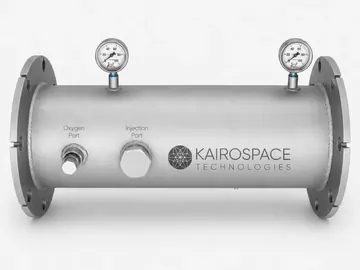 < 200 nmBubble sizeCharacterized by an independent laboratory (nanoparticle tracking analysis)Independent lab
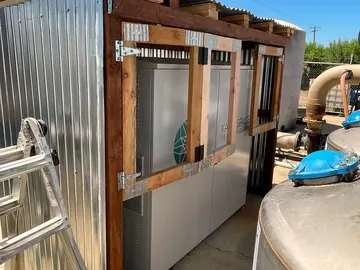 AgricultureConcentrators housed on site, next to the tanksOn a customer siteField photo
- < 1 yrPaybackOur model, run on our own field dataKST model
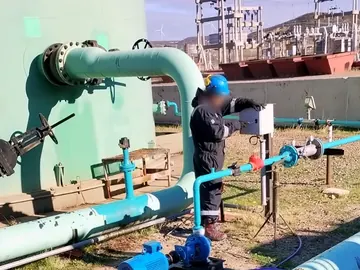 Oil & gasSetting the injection rate at the control panelWater handling at a tank batteryField photo
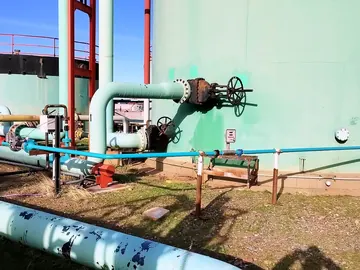 Oil & gasInjection line run out to the tank batteryWater handling at a tank batteryField photo
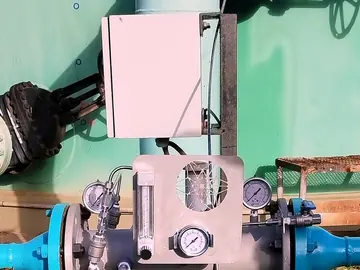 Oil & gasControl panel and injector at the tank skidWater handling at a tank batteryField photo
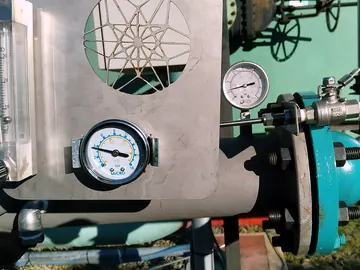 Oil & gasMetering panel at the injector flangeWater handling at a tank batteryField photo
| Metric | Value | Where | Provenance | Detail |
|---|---|---|---|---|
| Final yield | +15% | GB Sciences | Field | One site · distinct from biomass |
| Biomass | +30% | GB Sciences | Field | 0.23 → 0.31 lb/plant |
| Cuts per plant | +25–35% | CLTVTD | Field | Customer-reported · healthier mother stock |
| Veg & prop time | Shortened | Green Go | Field | Customer-reported · first room at 6 weeks |
| Dissolved oxygen, towers | 24.16 vs 8.05 mg/L | Southern Nevada vertical farm | Field | Treated vs control towers · two per group |
| Water penetration | +24.7% | Yorba Linda CC | Field | 3-month pilot · vs two control greens |
| Salt compaction | −35.4% | Yorba Linda CC | Field | 3-month pilot · Method being confirmed |
| Dissolved oxygen | +300% | Yorba Linda CC | Field | Treated green |
| Stem growth rate | 2.3× | FruitWorld | Field | 0.035 → 0.08 mm/day |
| Bubble size | < 200 nm | Independent lab | Lab | Nanoparticle tracking analysis · about 9 in 10 tracked particles below ~201 nm |
| Payback period | < 1 yr | KST model | Model | Varies by site |
| Root mass | up to 126% | Literature | Research | vs. untreated control |
| Germination uplift | 15–25% | Literature | Research | Seed trials |
| Fertilizer reduction | ~20–25% | Literature | Research | At matched yield |
| O₂ transfer efficiency | >85% vs ~15% | Literature | Research | vs. conventional |
| Aeration share of power | up to ~60% | Literature | Research | Plant power bill |
| Reagent savings | up to 50% | Literature | Research | Flotation |
| Fine-particle recovery | +16–21% | Literature | Research | Lost to tailings |
| Crude viscosity | up to 40% | Literature | Research | Reported range 33–84% |
Updated October 2026.
Field — measured in a Kairospace deployment or pilot.
Research — independent peer-reviewed literature, stated as such and never as our own result.
Lab — an independent laboratory characterized our water or our hardware, outside peer review; not our field measurement and not the literature.
How each tier is counted, and the house rules behind it: How we count. A figure with no source row does not appear on this site.
What does this do to your P&L?
Five live calculators — payback, NPV, and IRR on your own numbers, with a source on every assumption. Nothing gated, nothing to submit: the figures move as you type.
Choose your industry to continue with an estimate or a worked analysis of your process.
1-yr moving parts
laboratory (nanoparticle tracking analysis)
or your dealer
before you commit
Find out how much you're leaving on the table.
Tell us about your operation. An engineer replies within 48 hours, with a proposal or with the questions we need to write one.