Oxygen management and sediment
How high and for how long did nanobubbles raise dissolved oxygen in published trials, and what did studies find at the pond bottom?
On this page
Dissolved oxygen: how high, and for how long
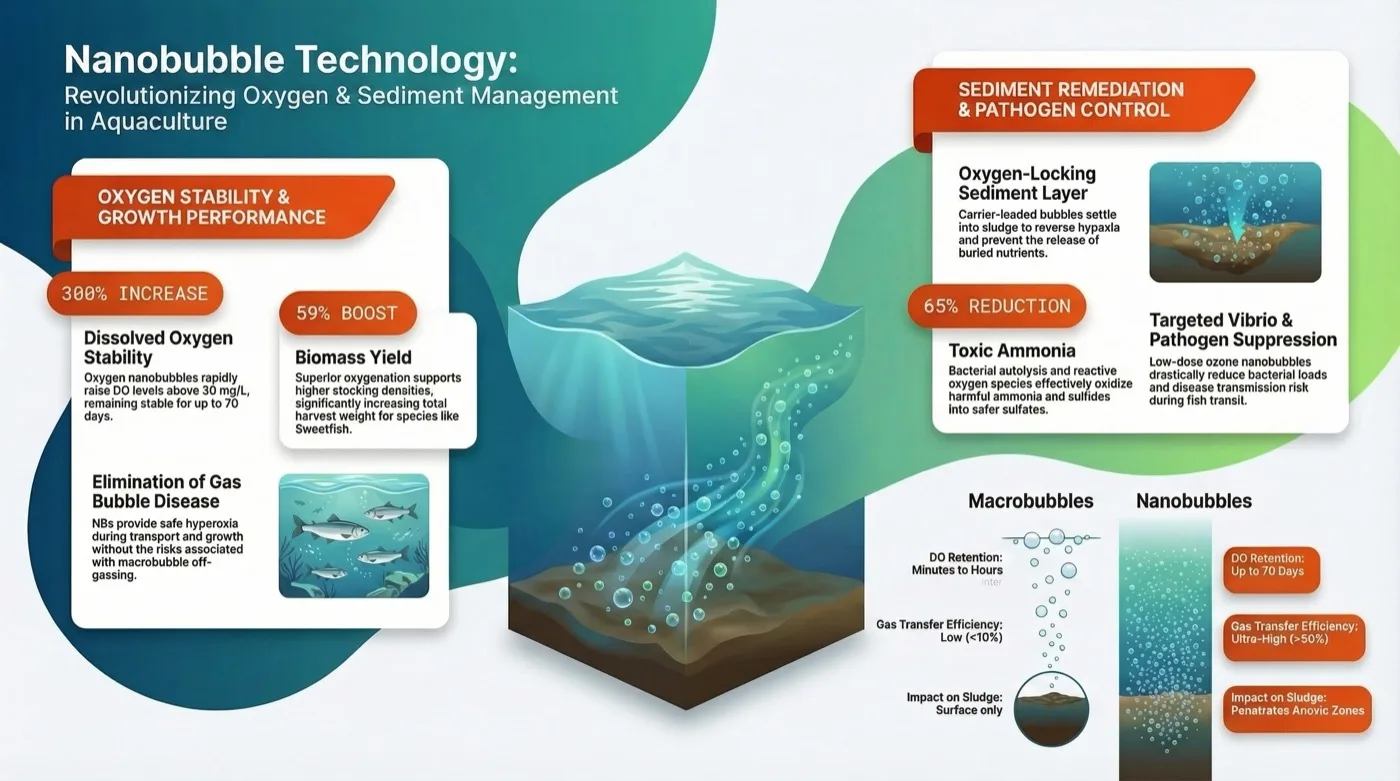
Oxygen nanobubbles () raised dissolved oxygen () from 7.7 mg/L to 31.7 mg/L within minutes of generation in the trials reported by Ebina et al., 2013. The authors described the bubbles as a gas reservoir held within the liquid, rather than bubbles that leave the water quickly.
The mechanism is buoyancy. Coarse bubbles from paddlewheels and air stones rise fast and burst at the surface, so much of their gas escapes before it dissolves. have negligible buoyancy and stay suspended in the water column, which is what lets the water hold oxygen above saturation.
A direct comparison came from tank work with ozone. Dissolved oxygen in tanks treated with ozone nanobubbles was considerably higher and more stable than in tanks given ozone macrobubbles through air stones Ng et al., 2023. That study was designed to assess the reduction of freshwater algae, so its oxygen readings are a secondary result.
The supersaturated peak did not last. In the Ebina trials, DO fell back from about 31 mg/L and then held at about 8.7 mg/L for an extended period Ebina et al., 2013. Separately, the same authors reported that nanobubble size and concentration in distilled water stayed relatively stable for up to 70 days when stored at 4 °C.
That second result describes bubbles in clean, cold water. It is not a measurement of DO in a stocked pond, and the lesson's sources do not show how long elevated DO persists once aeration stops.
Biomass in the rearing trials
The rearing trials recorded more biomass in nanobubble water. Rainbow trout reared in air-nanobubble water increased in total weight from 50.0 kg to 148.0 kg over 6 weeks, compared with 129.5 kg in normal water; sweetfish reached 10.2 kg in nanobubble water against 6.4 kg in control water Ebina et al., 2013.
These were air nanobubbles, not pure oxygen, and the trials compared water types rather than stocking densities. The idea that stable DO could support higher stocking densities without hypoxic stress is consistent with the results, but the trials did not test it. The lesson on growth performance and feed efficiency covers growth and feed conversion in more detail.
Pond sediment, ammonia and sulfide
Surface aeration mixes the upper water but does little for the bottom layer where sludge collects. Oxygen nanobubbles have been delivered to that layer in two ways: loaded onto carrier materials such as zeolite, or relying on their low buoyancy to settle into the sludge.
Once in the sediment, the bubbles released oxygen slowly and reversed anoxic and hypoxic conditions, forming what was described as an "oxygen-locking" layer that curbed the release of toxic substances from the sediment Shi et al., 2018.
Sludge from uneaten feed and feces releases ammonia (NH₃) and hydrogen sulfide (H₂S) under anaerobic conditions. Higher DO and the presence of reactive oxygen species () were associated with nitrification of ammonia to less toxic nitrate and oxidation of sulfide to sulfate. The same studies linked high DO to bacterial autolysis and lysis reactions that reduced total sludge production Rahmawati et al., 2021; Ahmed et al., 2023.
Those two studies worked in different settings: Rahmawati et al. in indoor shrimp raceway ponds, Ahmed et al. on secondary wastewater effluent treated with air and oxygen nanobubbles from ceramic membrane filters.
The largest ammonia figure in this lesson comes from wastewater, not a pond. Nanobubble aeration reduced ammonia by up to 65% compared with conventional aeration in constructed wetlands coupled with microbial fuel cells Lyu et al., 2023. The cited work does not show whether a comparable reduction occurs in a pond with daily feed inputs and an organic sediment.
Live transport: what is and is not tested
Live transport concentrates stress: in a small volume of water, oxygen falls quickly and ammonia builds up. Pre-saturating transport water with oxygen nanobubbles is a proposed use, but the evidence for it is indirect.
Ebina et al. studied rearing, not transport. Researchers reported high survival under intensive conditions and no gas bubble disease (gas embolism) in fish exposed to nanobubble supersaturation of up to 31.7 mg/L; supersaturation produced with macrobubbles, by contrast, can be lethal Ebina et al., 2013. Rearing at high density with limited water exchange resembles transport in some respects, which is why the result is relevant, but it is not a transport trial.
Low doses of ozone nanobubbles have also been proposed before or during transport to reduce bacterial loads such as Vibrio parahaemolyticus. The supporting studies measured ozone nanobubbles in tanks and under laboratory conditions with Pacific white shrimp, not during transport Ng et al., 2023; Nghia et al., 2022. The lesson on disease control and biosecurity reports those measurements.
What this means in practice
The findings above come from controlled tanks, raceways, laboratory set-ups and wastewater systems. A site that wants to know whether they hold under its own conditions needs its own measurements, taken side by side with a comparison unit on its usual aeration.
- Dissolved oxygen: log DO in mg/L at the surface, mid-depth and near the bottom, at dawn and after each feeding, in treated and comparison units.
- Sediment: track oxidation-reduction potential () near the sediment–water interface, and ammonia and sulfide in the water column.
- Production: record stocking density, survival, biomass and feed delivered for each unit over the full cycle.
- Ozone, if used: record the dose and the residual in the water, and run ozone trials separately from oxygen trials.
Oxygenation does not replace sanitation or biosecurity practice. To work through the economics at your own stocking and feed levels, use the aquaculture calculator.
Limits and open questions
- The trout and sweetfish results come from one study with air nanobubbles; this lesson does not report sample sizes or replicates for them.
- The 70-day stability figure was measured in distilled water at 4 °C, not in pond water with an organic load, and does not describe how long DO stays elevated.
- The oxygen comparison with macrobubbles came from ozone treatments in a study designed around algae.
- Sediment evidence comes from work at the sediment–water interface and from wastewater, not from long-running commercial ponds.
- The 65% ammonia reduction was measured in constructed wetlands treating wastewater.
- No cited study measured survival or water quality during live transport.
Questions
How long does nanobubble oxygen stay in the water?
In one study, oxygen nanobubbles raised dissolved oxygen to 31.7 mg/L within minutes, and it then settled near 8.7 mg/L. The 70-day figure is bubble stability in distilled water at 4 °C, not oxygen in a stocked pond, so persistence at a site needs its own measurements.
Can nanobubble supersaturation cause gas bubble disease?
Researchers reported no gas bubble disease in fish exposed to nanobubble supersaturation of up to 31.7 mg/L in rearing trials, whereas macrobubble supersaturation can be lethal. The trials covered rearing, not transport, so the result needs checking at a site's own densities, temperatures and durations.
Do nanobubbles lower ammonia in ponds?
The largest ammonia figure here, up to 65% lower than with conventional aeration, came from constructed wetlands treating wastewater. Pond and effluent studies linked higher dissolved oxygen to nitrification and sulfide oxidation, but the cited work does not quantify a reduction in a working pond.
References
- Ebina, K., Shi, K., Hirao, M., et al. (2013). Oxygen and Air Nanobubble Water Solution Promote the Growth of Plants, Fishes, and Mice. PLoS ONE, 8, e65339. https://doi.org/10.1371/journal.pone.0065339 ↩
- Lyu, T., Wu, Y., Zhang, Y., et al. (2023). Nanobubble aeration enhanced wastewater treatment and bioenergy generation in constructed wetlands coupled with microbial fuel cells. Science of The Total Environment, 895, 165131. https://doi.org/10.1016/j.scitotenv.2023.165131 ↩
- Ng, P. H., Huang, Q., Huang, L., et al. (2023). Assessment of Ozone Nanobubble Technology to Reduce Freshwater Algae. Aquaculture Research, 2023, 1-8. https://doi.org/10.1155/2023/9539102 ↩
- Shi, W., Pan, G., Chen, Q., et al. (2018). Hypoxia Remediation and Methane Emission Manipulation Using Surface Oxygen Nanobubbles. Environmental Science & Technology, 52, 8712-8717. https://doi.org/10.1021/acs.est.8b02320 ↩
- Rahmawati, A. I., Saputra, R. N., Hidayatullah, A., et al. (2021). Enhancement of Penaeus vannamei shrimp growth using nanobubble in indoor raceway pond. Aquaculture and Fisheries, 6, 277-282. https://doi.org/10.1016/j.aaf.2020.03.005 ↩
- Ahmed, A. K. A., Shalaby, M., Negim, O., et al. (2023). Eco-Friendly Enhancement of Secondary Effluent Characteristics with Air and Oxygen Nanobubbles Generated by Ceramic Membrane Filters. Environmental Processes, 10, 13. https://doi.org/10.1007/s40710-023-00628-9 ↩
- Nghia, N. H., Nguyen, N. T., Binh, P. T., et al. (2022). Effect of nanobubbles (oxygen, ozone) on the Pacific white shrimp (Penaeus vannamei), Vibrio parahaemolyticus and water quality under lab conditions. Fisheries and Aquatic Sciences, 25, 429-440. https://doi.org/10.47853/FAS.2022.e39 ↩